Motivation
Almost all robotic deployments are technically feasible: providing enough system integration work, data and engineering supervision, robots can run reliably on specific tasks with a clear scope.
However, the cost of achieving this reliability often exceeds the economic value created by automation itself. After all, humans are still several times higher in time and data efficiency than robots.
In this blog, we will introduce for the first time an exploratory work: how to build a more efficient Scaling Paradigm for robot learning using simulation.
Accelerating Policy Development
Traditional processes typically collect real-world remote control data from target robot hardware and then fine-tune and evaluate the Policy Checkpoint in the real world.
We have proposed a process to accelerate the development of the Policy using simulation:
Calibrate Simulation EnvironmentsFor details, see Evaluating 3D Simulation-ready Assets for Robotics and How to Close the Sim-to-Real Gap.)
How to evaluate policies in simulationTo achieve this, the simulation environment must provide what we call an L3 level guarantee, the Policy-level Guarantees (see Pushing the Frontier for Simulation Environment Generation).
Improve Policies with SimulationAccording to the evaluation results, using RL or the robot trajectory collected in the simulation to improve the Policy. Compared to the real world, the simulation can significantly change the camera, lighting and physical conditions of the task, while also providing privileged information.
The conversion efficiency comparison
It's only in the real world:
It takes about 5.5 days for each shift.
Task Definition: One-time completion, about 3 days.
Gather real data: 2 days.
Policy Improvement and Training: 12 hours.
Real environmental assessment: 2 days
Policy Diagnosis: Man-made, about 1 day.
Simulation enabled:
It takes about 20 hours for each shift.
Using real data to calibrate a simulation environment: 1 hour.
Policy Improvement and Training: 12 hours.
Simulation evaluation: 5 hours.
Policy Diagnosis: Completed by Agent, about 3 hours.
Transitioning the timeline
Real environments are developed in collaboration with simulation:
Starting from a single mission definition, development progresses in parallel in real robots and simulation environments.
Real-world processes: task definition → data collection → training → evaluation → diagnosis
Simulation process: Calibrate the simulation environment → sim-v1 → sim-v2 → sim-v3 → sim-v4 → sim-v5 → sim-v6
The graph shows the cyclical process of the first and second weeks.
The first day:
Real environment: defining tasks.
Simulated environment: Wait.
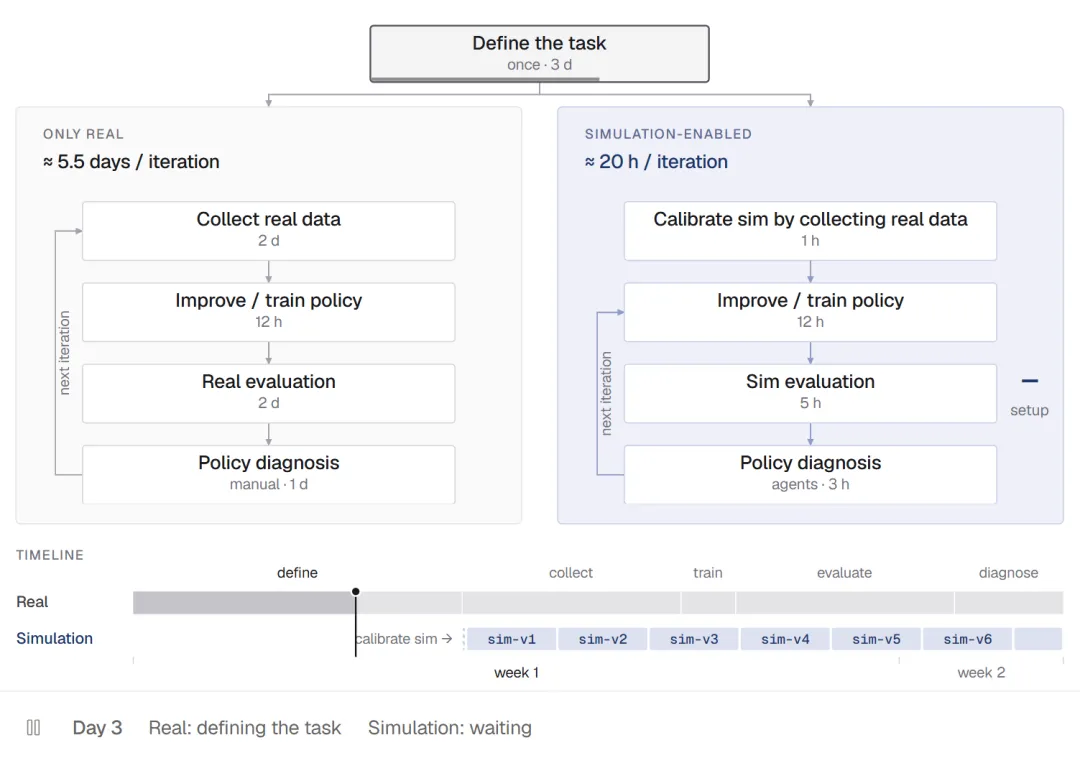
Through drag-and-drop timelines, you can gradually see how real robots and simulation environments move forward in parallel, starting with mission definitions.
Key Questions
In the next experiment, we hope to answer the following key questions:
How strongly does the performance of a simulation correlate with that of a real robot?
How to effectively use emulation to improve policy performance?
What is the rate of improvement of the Policy through simulation?
The experiment involved three two-armed operational tasks:
1. sort-from-tote
This is a high-contact-rich operation in a factory scene.
A gray container is located on the left side, which contains various industrial parts, such as screws, bolts and bearings. A two-armed YAM robot needs to classify these parts into a red sorting machine.
Because of the smaller size of the parts, it is difficult for a robot to successfully grab if it lacks sufficient operational accuracy and failure to recover. In this case, the slot on the far right of the red sorting machine requires the robot to perform precise arm coupling on small objects.
2. bottles-in-the-bin
This is a basic Pick-and-Place task.
A two-armed YAM robot needs to grab a bottle that is scattered on the table and put it in a container.
Due to the limited working space of the robot, in order to successfully grab all the bottles, the robot needs to coordinate both arms and slightly move the position of the receiver box.
3. mug-flipping
It's a two-armed crossover mission.
The two-armed YAM robot needs to turn all non-vertical cups into a vertical state.
Due to the limited range of motion of the wrist joints in the YAM, a single arm is unable to rotate the half-circle needed to make the cup that has been grasped stand upright. Therefore, for the reverse cup, the robot must complete the operation by joining the arms: one arm first raises and tilts the cup, and the other arm then grabs the cup along, placing the cup upright.
Calibrate Simulation Environments
We first created a simulation environment for the above three tasks, and then used a small number of real-world remote-operation tracks to calibrate the properties of robots, cameras and the physical properties of the environment.
Of these, the camera calibration includes the camera's position, lens and exposure parameters; environmental physical properties include the mass of the object, frictional force, etc.
Evaluating 3D Simulation-ready Assets for Robotics and How to Close the Sim-to-Real Gap can be consulted for how to combine building and calibrate physical engine assets, scenarios and their physical properties.
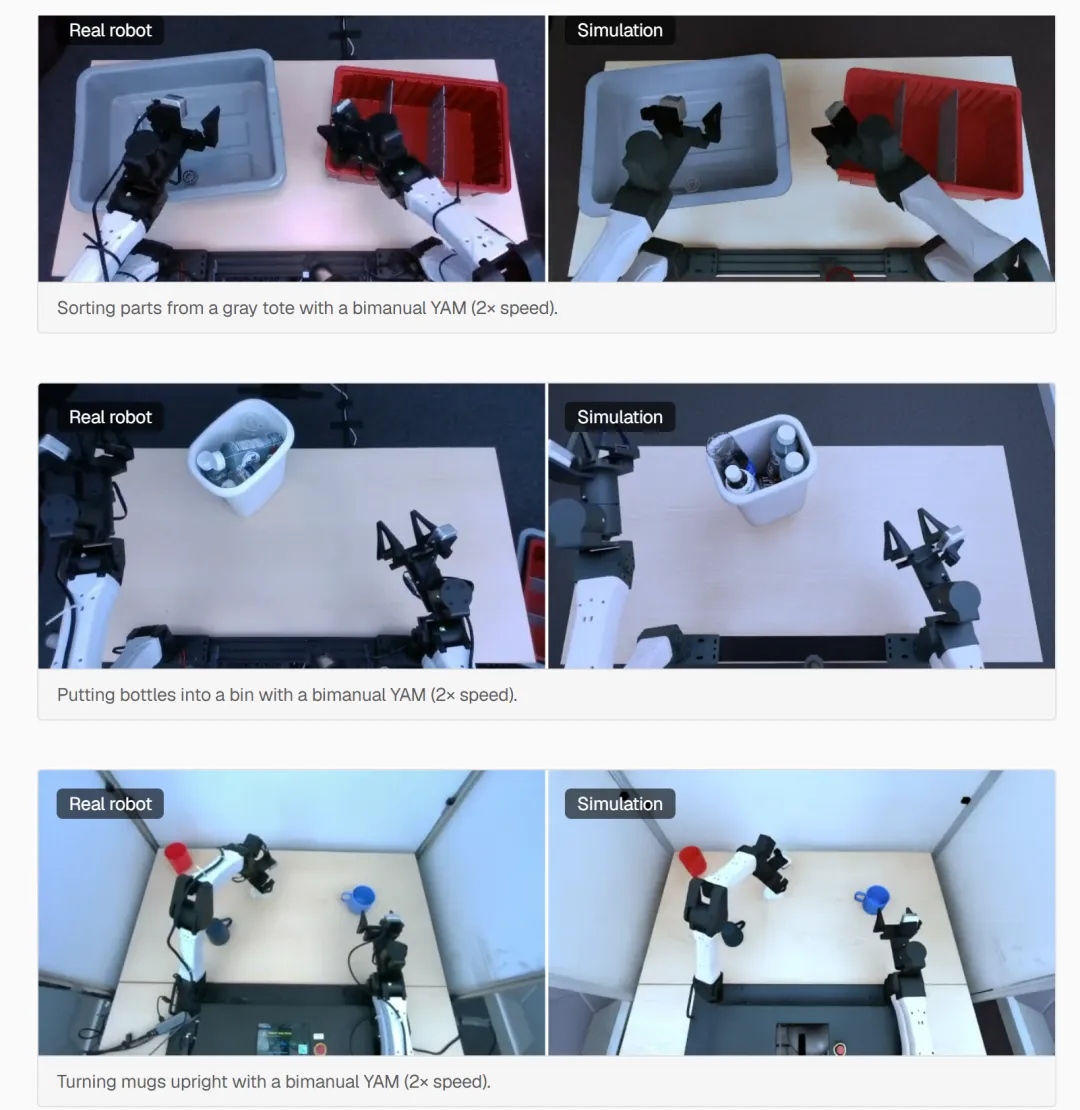
The graph shows the performance of three tasks in real robot and simulation environments:
Two-armed YAM separates the parts from the grey receiver box (two times the speed).
The two-armed YAM put the bottle in the receiver box (twice faster).
The two-armed YAM turns the cup into a vertical state (twice the speed).
Evaluate Policies in Simulation
In the real world, the cost of evaluating Policy is high.
Every real-world Rollout requires someone to reset the scene, evaluate the execution results, and screen for hardware issues. In order to reduce the confidence interval between different Checkpoints, a large number of Rollouts are usually required.
We believe that real-world assessments are essential, but simulation can significantly accelerate the process of iteration.
Data Recipe, Data Filtering Pipeline, and Data Enhancement Programs were analyzed to determine the best configuration for the current task.
Compare the performance of different Base Models, hyperparametric configurations and training methods.
Evaluate different Checkpoints during training to understand the changing trends in model performance.
Use Agent to automatically explore the best Policy training formulas without the need for human intervention.
Evaluation Protocol
In order to ensure the rigorousness of subsequent experiments, we adopted the same evaluation protocols for all experiments, avoiding missions distribution differences that affect the correlation between simulation and real-world environments.
First, we define the allocation of objects to be evaluated in a layered manner.
For example, bottles-in-the-bin:
There's only one bottle on the first floor.
The fifth floor contains 4 to 5 bottles, which can be held upright or upside down.
The specific process is as follows:
Sampling from the target distribution, exemplifying corresponding scenarios in a simulation environment, and recording the configuration parameters of each sample.
Use a hash-fixed final configuration set to avoid modifying the configuration without an explicit version upgrade.
In simulation Rollout, the configuration parameters of the second step record are directly loaded.
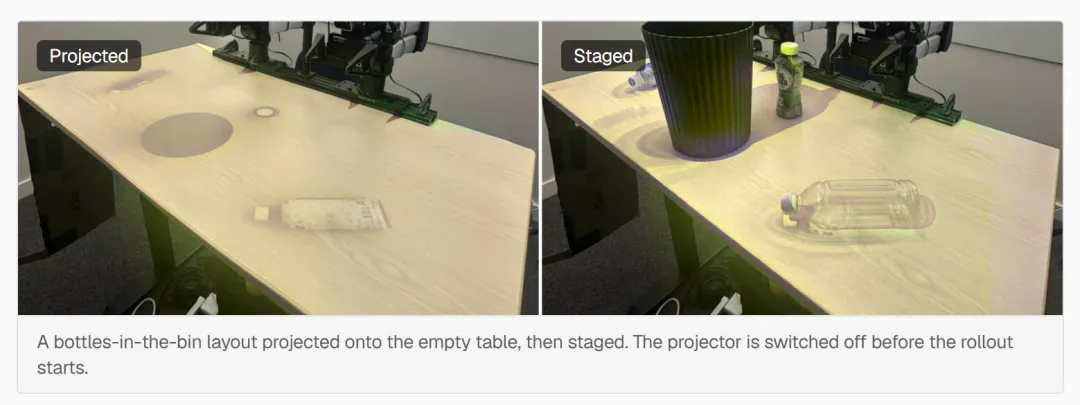
In real-world robot Rollout, the projector is installed on top of the desktop and is used to project objects onto the desktop. The projector is calibrated through the edge of the desktop so that the operator places the objects as accurately as possible.
Graph: The object layout of the bottles-in-the-bin task is first projected onto an empty table and then placed by the operator as projected.
For real-world Rollout, in order to reduce the fatigue of operators, each assessment session is designed to last about 1-1.5 hours.
Simulation Rollout can be expanded with increasing computational resources, so we will repeat each configuration multiple times to reduce the trust gap.
In addition, to ensure that the results are comparable, we use the same episode length for the simulation and the real environment.
Below are the three task-level evaluation configurations:
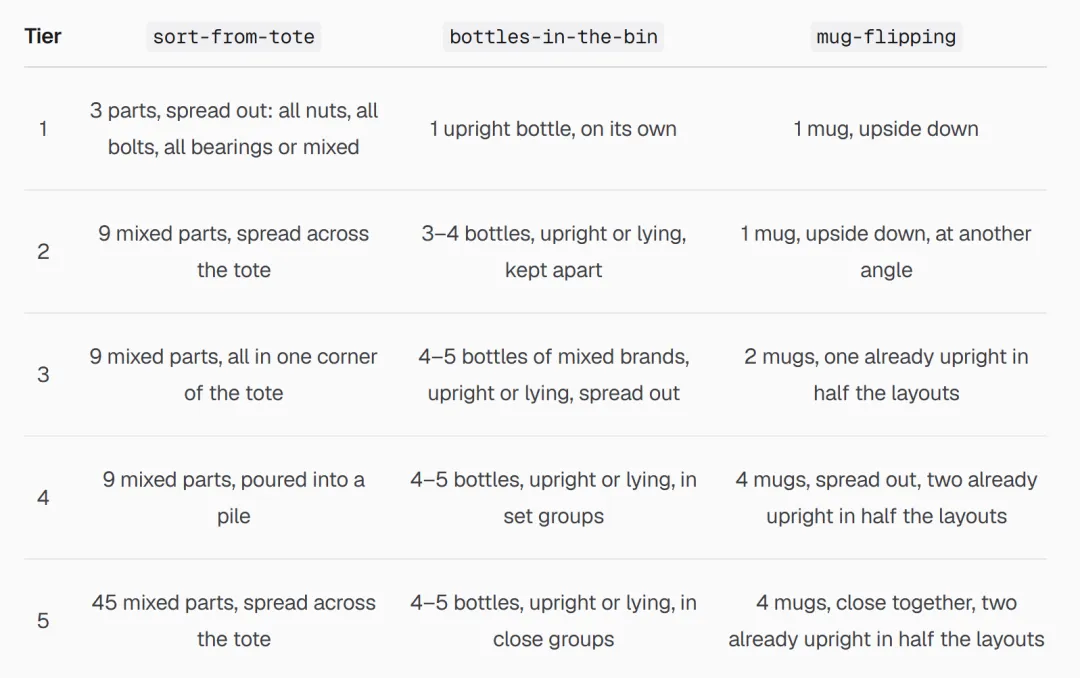
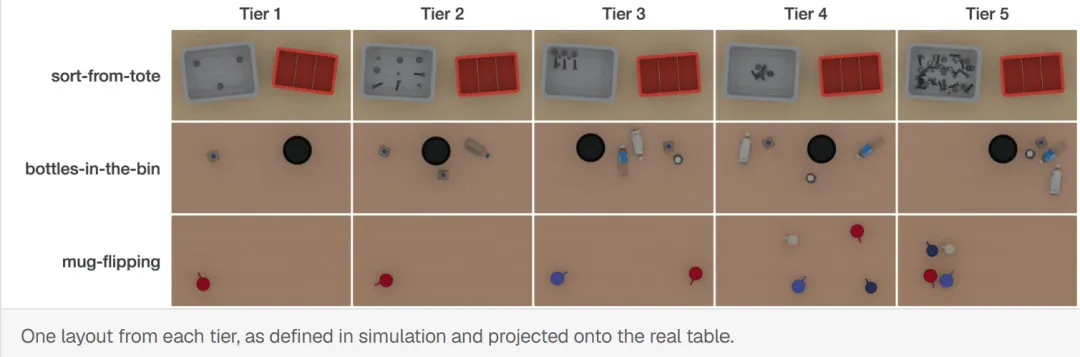
Graphics: Each Tier selects a layout, defines it in a simulation environment, and maps it to a real desktop using a projector.
Sim-Real Correlation
How to ensure that the experience gained in evaluating Policy in a simulation environment can be transferred to real robots?
The first step is to establish a Sim-Real Correlation (Sim-Real Correlation) between the simulation and the real environment, and the results of the execution of a specific trajectory or Policy.
In order to establish this relevance, we used internal real remote operation trajectories for sort-from-tote and bottles-in-the-bin missions; for mug-flipping missions, we used open real-world trajectories provided by ABC-130k.
For each task, we used about 50, 100, 200 and 400 episodes to fine-tune the PI-0.5 Policy.
In the end, we got 12 policies and evaluated them on simulated environments and real robots respectively.
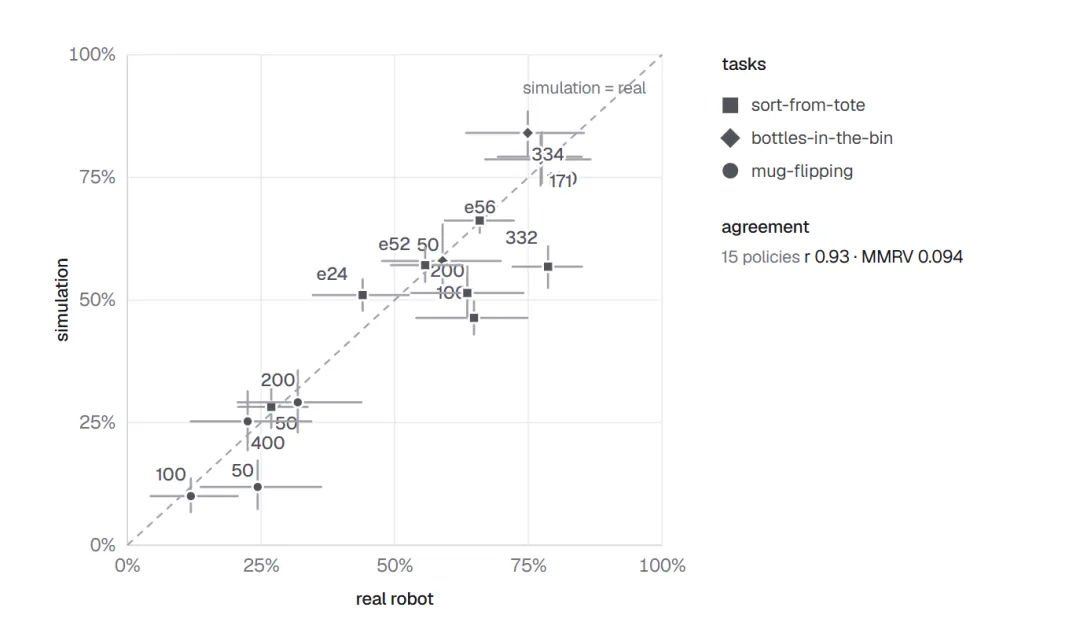
Figure 15: Policy's performance correlations in simulation and real-world environments contain 95% confidence intervals. The numbers represent the number of trained episodes, and e represents the RL Epoch.
Relativity indicators:
Pearson related coefficients
The average maximum number of non-compliance (MMRV) = 0.094
The above indicators are based on 15 Policy calculations.
With the Simulation Autoresearch Stack, a simulation automation research system that we have built, the progress of the simulation environment and tasks on real robots is highly consistent between these 15 policies.
This gives us confidence to say: if a Policy performs well in a simulation, it will perform well in a real robot; if it does not perform well in a simulation, it will not perform well in a real robot.
We found that physical factors have a greater impact on achieving higher Policy-level Sim-Real Correlation than visual factors.
This includes the following details:
Select the right Solver and Kernel for the task.
Proper approximation of physical processes is performed to accelerate simulation only on the premise that it does not affect policy-level behavior.
Depending on how objects are used in specific scenarios and tasks, objects' details are reasonably modeled, such as fine-grained collision proxies.
Policy Diagnosis
Once a trusted simulation environment is established, we can systematically diagnose Policy.
We can use Agent to autonomously diagnose Policy in a simulated environment, and specific processes include:
Observe the execution results.
Identify the most frequent failure patterns in Policy behavior.
Agent independently updates the simulation environment and test use cases to further validate these failure patterns.
Take bottles-in-the-bin as an example: After testing Policy in different Tier evaluation scenarios, Agent correctly judges that when bottles are more densely arranged, the Policy will often hit the adjacent bottles on the table.
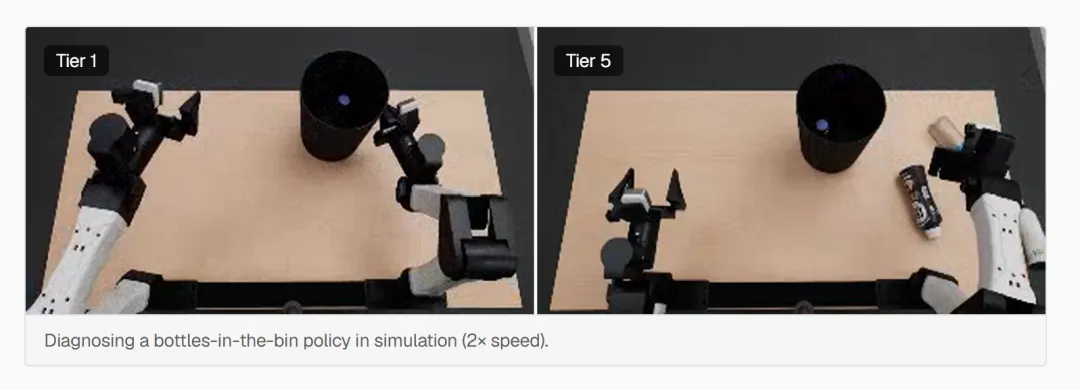
Graphics: Diagnosing bottles-in-the-bin Policy in a simulated environment, 2x faster, showing different scenarios from Tier 1 to Tier 5.
When we are able to effectively diagnose Policy, the next question is: What is the best way to use simulation to improve Policy?
Improve Policies with Simulation
Below, we will first introduce Guided Domain Randomization, then explore Rejection Fine-tuning and RL for contact-intensive sort-from-tote tasks; and then explore Privileged Policy Distillation for bottles-in-the-bin and mug-flipping.
Real remote data is usually best for contact-intensive tasks that require precise control.
In sort-from-tote tasks, there may be small movements of parts, which Policy must detect in a timely manner in order to successfully capture, so we chose to train based on existing remote-operating data.
Bottles-in-the-bin and mug-flipping tasks can be solved through IK and well-designed trajectory planning.
Guided Domain Randomization
Domain Randomization is an important way that Moonlake is currently using simulation to evaluate and train.
The key is that the range of randomization should be guided by previously diagnosed failure patterns, rather than a uniform randomization of all parameters.
Specifically, the Agent reads the evaluation results, identifies the conditions under which the Policy is likely to fail, and then uses the simulation to generate system configurations that require randomized parameter distributions.
For example, bottles-in-the-bin:
Because Policy is easy to collide with adjacent bottles when arranged in bottle density, randomization is more focused on the bottle layout, while also changing camera posture, lighting and the attributes of Policy-sensitive objects.
Subsequently, the revised Policy was re-evaluated using the same Tier, forming a closed loop.
Domain Randomization is just a way to mimic and improve Policy, and we're exploring other ways.
The following two sections will present what we have tried: Rejection Fine-tuning with RL, and Privileged Policy Distillation.
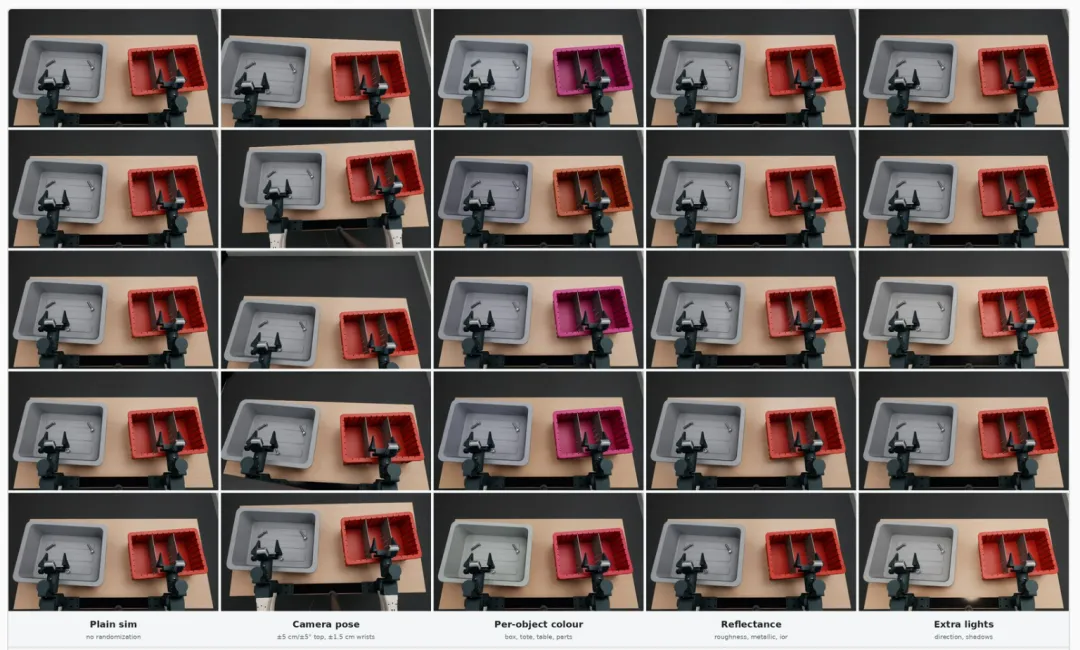
Graph: Domain Randomization by changing camera posture, object properties, lighting, and other factors.
Rejection Fine-tuning and RL
In this experiment, we used the sort-from-tote task and assumed that only 50 real remote-operated episodes could be obtained.
First, we used these 50 real remote-operated episodes to fine-tune the PI-0.5.
As shown in the first stage of the chart below, after training to about 40k Steps, Task Progress does not continue to improve.
Subsequently, we changed a number of conditions in the simulation environment, such as lighting, camera posture and part colour, to Rollout the modified Policy.
We filtered out the success stories and combined a small amount of real data with a successful simulation Rollout for Sim-and-Real Co-Training.
Rejection Fine-tuning is used at this stage.
After 10k Steps additional training, Task Progress improved by 11 percentage points.
Based on simulation and real-world combined training, we further used RL Training Policy to run 384 simulation environments in parallel.
Reward directly uses mission indicators:
- Each successful placement of a part in the correct slot is rewarded with a +1.
- Each item that hits the target area is rewarded with −1.
- No use of Reward Shaping.
In the end, Policy improved its performance in the simulation environment by 38 percentage points and its performance in real-world assessments by 39 percentage points.
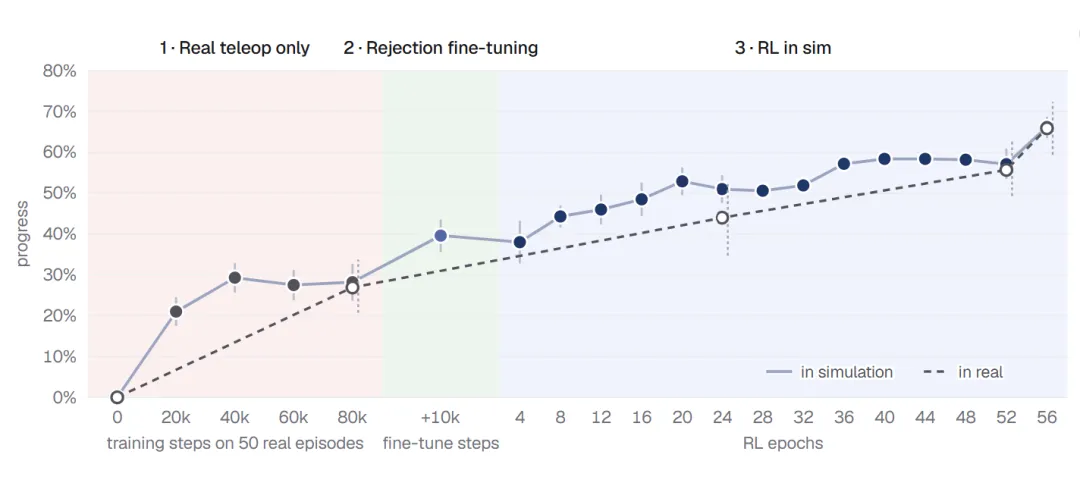
The chart is divided into three phases:
Real Teleop Only with real remote control data
- It's about 50 real episodes of training.
Rejection Fine-tuning
- Additional 10k Steps are performed.
RL in the simulation
- According to RL Epoch, training progress was shown.
Graph: Sort-from-tote tasks in the Rejection Fine-tuning and RL phase of Task Progress, with each Checkpoint showing its 95% confidence interval.
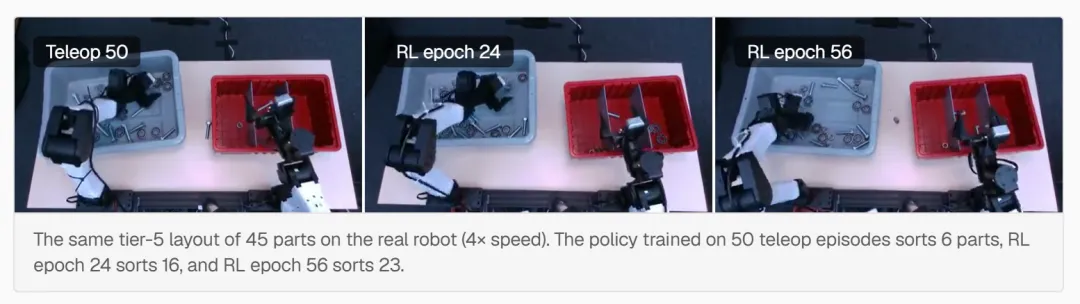
Graph: Real robots process 45 parts under the same Tier 5 layout (four times faster)
Using 50 remote-operated episodes, Policy: Sorting out 6 pieces.
RL Epoch 24: A selection of 16 pieces.
RL Epoch 56: Selecting 23 pieces.
In addition, we found that the Rejection Fine-tuning phase is crucial for RL.
In the RL phase, each simulation environment randomly modifies the camera's posture, color, reflectance, and lighting.
Without this stage, the number of parts that can be sorted under these randomized conditions will be reduced by 3 to 4 times and rarely receive Reward.
RL training directly at this Checkpoint can't improve either.
By contrast, the Fine-tuning Policy has learned the relevant knowledge from Randomized Rollout so that Rewards can be gained from the start of training and continuously improved on this basis.
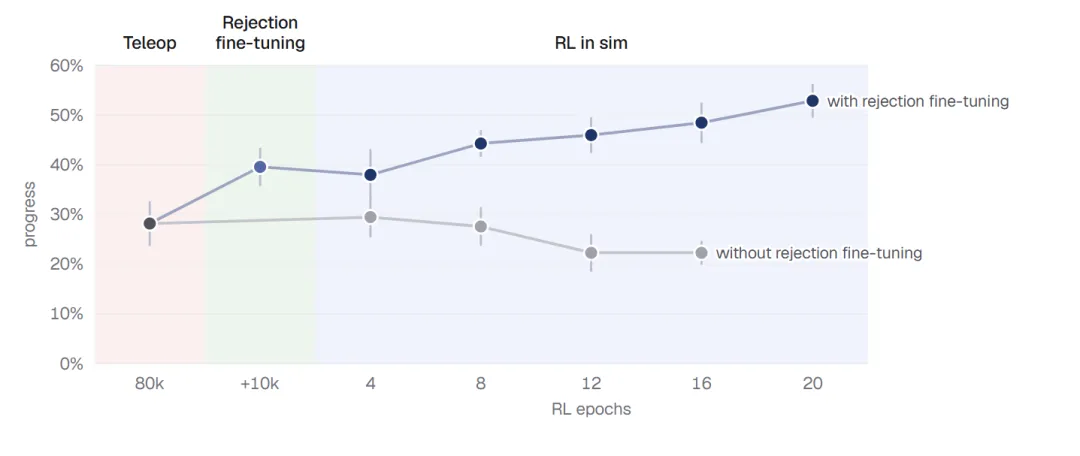
Graph: Using the same RL formula, compare the training results of Rejection Fine-tuning to whether it was done first. Both groups of experiments showed 95% confidence intervals at each Checkpoint.
When the physical simulation is accurate enough, the RL in the simulation can improve the performance of the Policy on real robots, and this improvement is particularly evident in contact-intensive operations.
RL performance of front-and-back layered missions
Here's how Task Progress works in the real world:
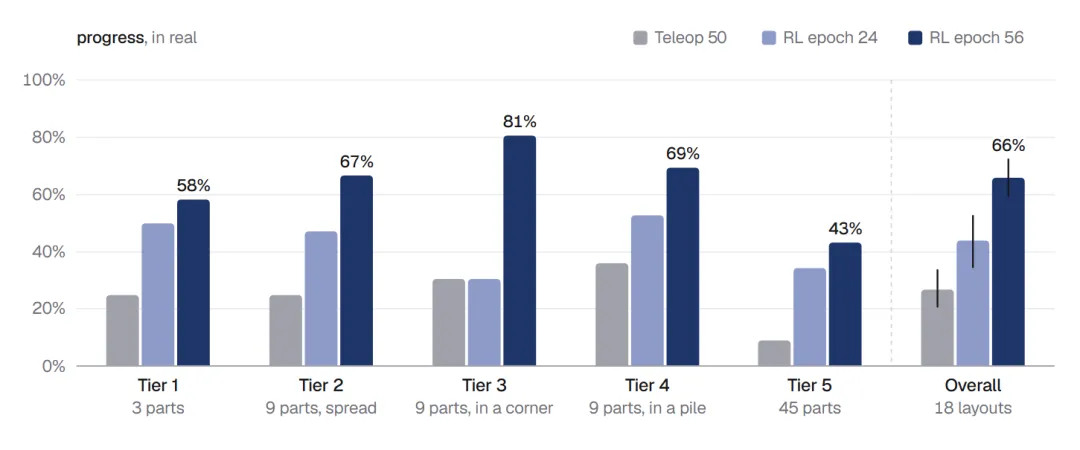
The graph compares the progress of the sort-from-tote hierarchical tasks before and after RL. Each layout executes an Episode, and the Overall data contains 95% confidence intervals.
Changes in behavioural indicators:
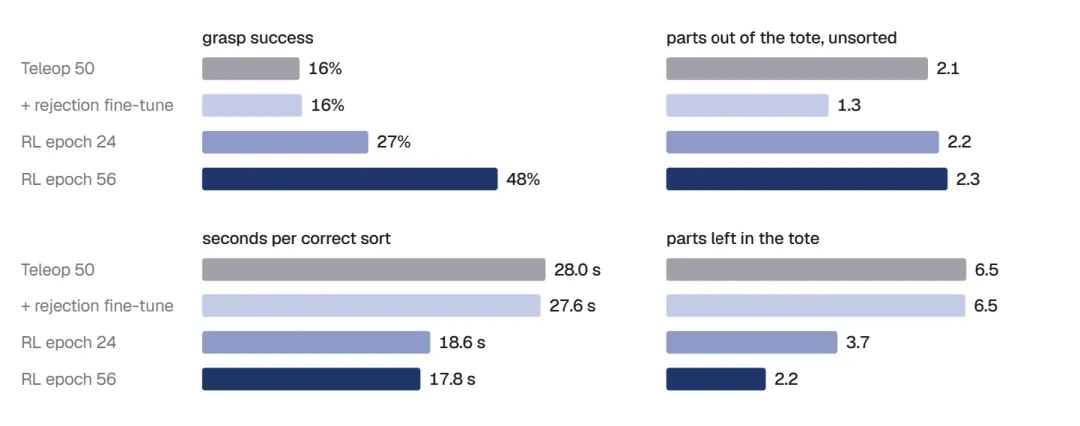
The success rate is deduced from the claw signal. Unfinished parts are those that have left the receiver box but have not entered the correct slot.
Success rates for sorting different types of parts:

The above data shows the correct proportion of parts sorted in a simulated environment, as opposed to the performance before and after the RL.
Zero-Shot Transfer via Privileged Policy Distillation
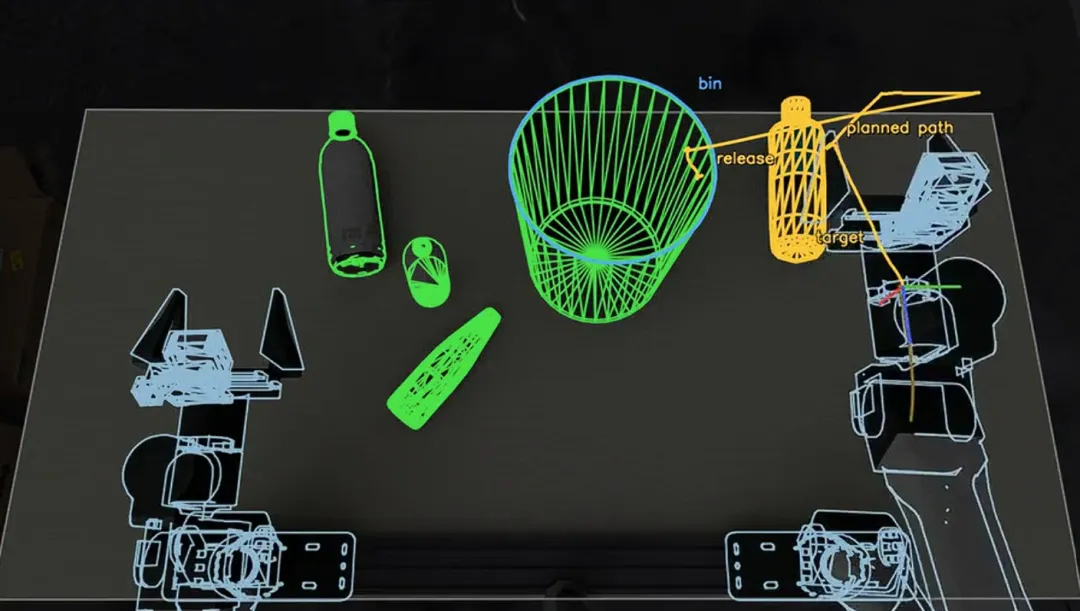
Simulation has one advantage that has not yet been fully explored: through simulation engines, we can directly access privileged information about the state of the world.
This information includes the real-world status of objects, such as their location, direction, speed, and physical parameters.
In this experiment, we used this privileged information to build a Policy, called a Privileged Policy, and then distilled it into a version that didn't rely on privileged information because it wasn't directly available in the real world.
Specifically, we implemented Privileged Policy as a Code Policy (Code as Policies) that enables it to run Rollout in a simulated environment and record corresponding trajectories, including visual observation, robot status and actions.
Subsequently, we screened out the successful trajectories and used a different number of simulation episodes to fine-tune the Base Model. The Base Model used in this experiment is PI-0.5.
Finally, we compared these policies to Task Progress on real robots, which uses only real remote data training.
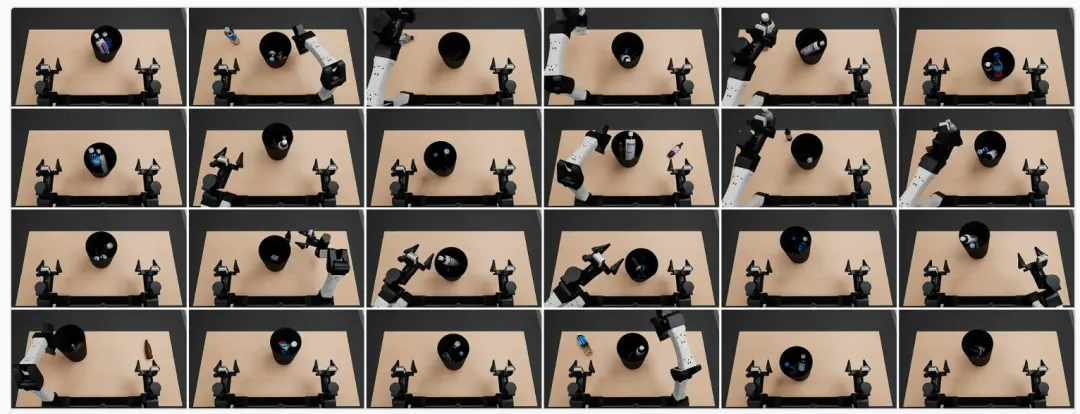
Graph: 24 episodes, bottles and containers, drawn from 400 simulated episodes, are randomly placed (two times the speed).
bottles-in-the-bin
The graph shows the different training data scales, and the Task Progress on real robots.
The lateral axis: the number of training episodes, 0, 50, 100, 200 and 400 respectively.
The data is divided into two groups:
Real Teleop Data: Real remote control data.
Simulated Data: Simulated data.
The results of the graph under different training scales include:
Real remote data: 59.0%, 77.5%, 77.3%, 74.9% and so on.
Similar data: 25.7%, 55.5%, 59.5%, and so on.
mug-flipping
Similarly, it compares the performance of real robots under different training data scales.
The lateral axis: the number of training episodes, 0, 50, 100, 200 and 400 respectively.
The data is divided into real remote-operated data and simulated data.
The chart shows the results of Task Progress on different data scales, including 24.4%, 11.9%, 31.9%, 22.5%, 19.4%, 44.4%, 38.8% and 38.1%.
The above experiments were evaluated after 80k Training Steps. Each result was calculated on the basis of 40 layouts and showed a 95% confidence interval, with each configuration running once.
It should be emphasized that this is a Zero-Shot Transfer experiment.
Policy, which uses the Privileged Policy simulation data training, has no access to any real-world data, with the only exception: a real remote-operated trajectory is used to calibrate the environment in the simulation environment used to generate the Privileged Policy.
In the end, Policy, which used only simulated data training, also successfully migrated to real robots, achieving Zero-Shot Transfer.
Results
In summing up the above approach, we want to answer one question:
With the same resources invested, what progress would be made if the Policy improved loop was run in a simulated environment, as opposed to a process that relies entirely on the real environment?
We first discuss how to measure development costs and then give a comprehensive comparison of the three tasks.
Characterizing Development Cost
We compared two development processes:
Real-only:
Data is collected from real robots and trained and evaluated on real hardware.
Sim-enabled:
Transferring data collection and evaluation links to a simulation environment.
Among them:
sort-from-tote using Sim-and-Real Co-Training and RL.
bottles-in-the-bin and mug-flipping using the Zero-Shot Policy.
Both processes have a maximum of four iterations, each involving data collection, training, evaluation and diagnosis, and using the same task layout.
We used the Policy Performance on real robots as a perpendicular axis, with the cumulative resource cost as a horizontal axis, to draw the performance changes curve of the two processes. See the appendix for more details.
A Simulation-enabled Scaling Paradigm
As shown in the chart below, after averaging the results of the three tasks, simulation-assisted Scaling Paradigm is able to achieve substantially the same task progress at a significantly lower cost as pure-real-world processes.
The chart shows:
Long axis: Policy Performance on real robots, three tasks take average.
X-axis: The cumulative resource use cost of each task, in units of dollars, using a pair of coordinates.
Sim-enabled: Simulated supporting processes.
Real-only: a purely real-world process.
Resource costs include:
Operator time and engineer time spent in remote operation and robot evaluation.
Cloud GPU resources for simulated data generation, simulated evaluation and RL.
Since the training costs of the two processes are the same, training costs are not included in the graph.
Closing Remarks
In this article, we show you how to use simulation to accelerate policy development.
By emulating the Policy, only a fraction of the resources of a purely authentic environmental process are needed to achieve the same level of reliability.
Moonlake's Environment Hub
The three tasks presented in this article are only a small part of the simulation environment we have built.
Moonlake's Environment Hub contains a large number of calibrated real-world deployment mission simulation environments. Each environment is specially constructed to ensure that evaluation, data generation and reinforcement learning can run in the same environment.
The team can take advantage of these environments:
Policy was evaluated before contacting a real robot.
Produced training data.
The reason for the failure of the Policy diagnosis.
References
Physical Intelligence. π0.5: Open-World Generalization.
Yilun Du. Generalization by Construction, 2026.
Moonlake. Evaluating 3D Simulation-ready Assets for Robotics.
Moonlake. How to Close the Sim-to-Real Gap?
Moonlake. Pushing the Frontier for Simulation Environment Generation.
Xuanlin Li, Kyle Hsu, Jiayuan Gu, et al. Evaluating Real-World Robot Manipulation Policies in Simulation (SIMPLER). CoRL 2024.
Arhan Jain, Mingtong Zhang, Kanav Arora, et al. PolaRiS: Scalable Real-to-Sim Evaluations for Generalist Robot Policies. RSS 2026.
Nadun Ranawaka, Josiah Wong, Wei-Lin Pai, et al. SimFoundry: Modular and Automated Scene Generation for Policy Learning and Evaluation, 2026.
Jacky Liang, Wenlong Huang, Fei Xia, et al. Code as Policies: Language Model Programs for Embodied Control. ICRA 2023.
Zheng Yuan, Hongyi Yuan, Chengpeng Li, et al. Scaling Relationship on Learning Mathematical Reasoning with Large Language Models, 2023.
Arthur Allshire, Himanshu Gaurav Singh, Ritvik Singh, et al. Scalable Behavior Cloning with Open Data, Training, and Evaluation (ABC-130K), 2026.
Abhiram Maddukuri, Zhenyu Jiang, Lawrence Yunliang Chen, et al. Sim-and-Real Co-Training: A Simple Recipe for Vision-Based Robotic Manipulation, 2025.
Appendix
Footnotes
1. Definition of Task Progress
Task Progress is the ratio of the number of objects that have been completed to the number of tasks that have been completed.
For sort-from-tote, calculate the number of parts correctly placed in the target slot, as a proportion of all the parts on the desktop.
For bottles-in-the-bin, calculate the number of bottles successfully placed in the container as a proportion of the total number of bottles targeted.
For mug-flipping, calculate the number of cups that have been successfully flipped to the vertical state, subtracting the number of cups that have been knocked over, and then subtracting the number of cups that have not been vertical in the initial state.
2. Definition of relevance indicators
Show the Pearson correlation coefficients for each data point in the graph.
The method of calculating MMRV (Mean Maximum Rank Violation, mean largest ranking violation) is: for each data point, find all the data points that are in the opposite order evaluated by simulation, calculate their maximum performance gap in real robot evaluation, and then average all data points.
MMRV is 0, which means that the simulation of the ordering of all data points is perfectly consistent with the real robots.
3. Calculation of resource costs
The resource use cost charts calculate the consumption of resources per generation at market prices, including:
The time required for remote operation and real robot evaluation of operators and engineers.
Simulating data generation, simulation evaluation and on-demand cloud GPU resources used by RL.
The resource cost of each data point represents the cumulative resource consumption up to this turnaround.
Citation
Moonlake AI. A Simulation-enabled Scaling Paradigm for Robot Learning. October 2026.