In the shadow of the hacker empire, the architect (The Architect) can manually rewrite the rules of the world to observe how the world reacts:
Simulation is not uncommon, from the small town of Stanford with 25 agents to MiroFish, from Twinmarket to MatrAIx, the demo layers are endless, but one important problem remains unresolved:
As the scale of the simulation increases, large models process the token cost of the simulation, GPU time cost, harness cost, often showing geometrical growth, i.e. technology cannot scale up easily, and expensive API and GPU costs have also turned the millions-to-million agent-level social simulation into the patents of large factory and monopoly resource teams.
This time, the S2-MAS research team at the University of Hong Kong expanded the size of the social simulation family to 12 million households, at a cost of only 14 GPUs, and took 4 hours. The study was led by Prof. Liu Liu, who co-authored it. The computational efficiency made it possible for single-card servers to run millions of Agent simulations, and also allowed large-scale social simulation to enter more research teams.
S2-MAS: A Society-Scale Multi-Agent Simulation Framework with 500 Million Household Persona Agents
Address of the paper:https://arxiv.org/abs/2610.27746
Address of the project:https://github.com/KataDavidXD/s2-mas
Model weight:https://huggingface.co/collections/ya9919/s-mas-models-sharp
Data sources:
The author explains:
This work was led by Professor Rohan of the University of Hong Kong, with collaborative units including the Hong Kong College of Management, the Shenzhen Institute of Management, the Shenzhen Institute of Management, the National Institute of Risk Management at the National University of Singapore, the California Institute of Technology, the Hong Kong University of Computing and Data Sciences, the South China University of Technology, the Annaburg Branch of the University of Michigan, the Chinese University of Hong Kong, and the Institute of Artificial Intelligence at the Jiangxi University of Technology.
The First Principle of Scalability
Scaling requires a hundred times more acceleration, so what we need is not only faster agent infra, but a rethink from zero about how social simulation becomes possible. Professor Rowan's core idea is to go back to the principle of sexuality and rebuild the social simulation triangle from the ground up. The overall framework mainly consists of three core parts: 500 million consumer home image libraries, 2 lightweight decision model family YN-mini, and 3 high-performance simulation engine Genese.
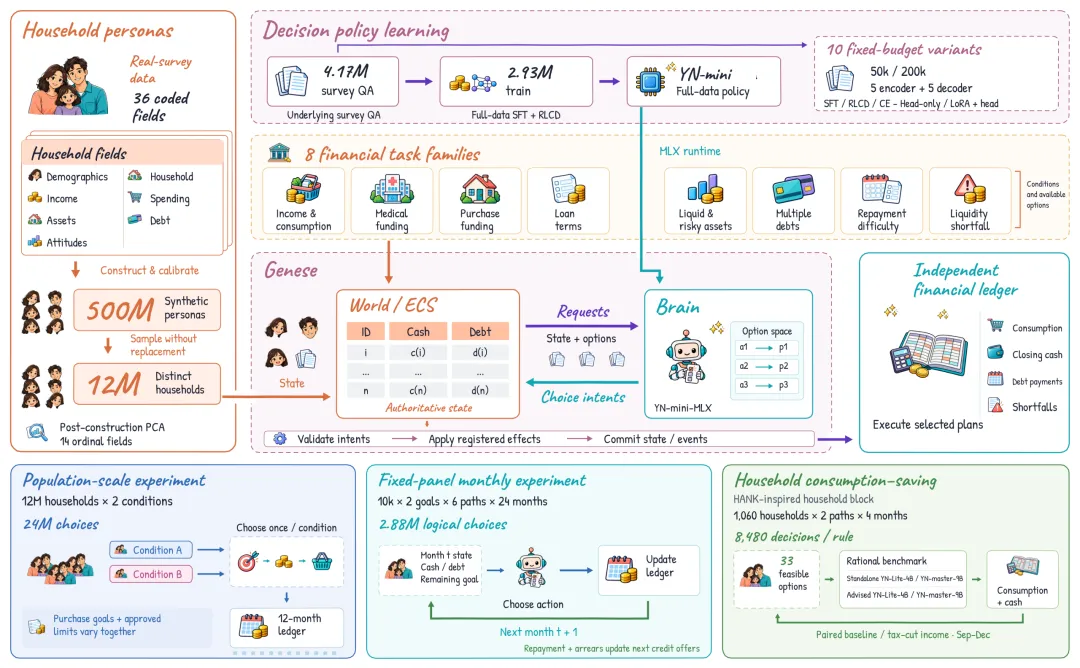
S2-MAS overall framework. Family portraits, decision learning and Genese engines link population building, action choices and financial ledgers; the following shows population-scale experiments, fixed panels of monthly scenarios and household consumption, spending and savings issues.
Data: From 500 million images to 12 million households
36-dimensional family images and conditions generated
The persona (person) of S2-MAS describes the family and its financial decision-makers as objects. Each image uses a unified set of 36 structured fields covering demographic background, family structure, income, expenditure, assets, debt and financial attitudes. This information collectively determines the starting point when a family faces consumption and financing schemes.
According to the use of information, these fields can be summarized as follows:
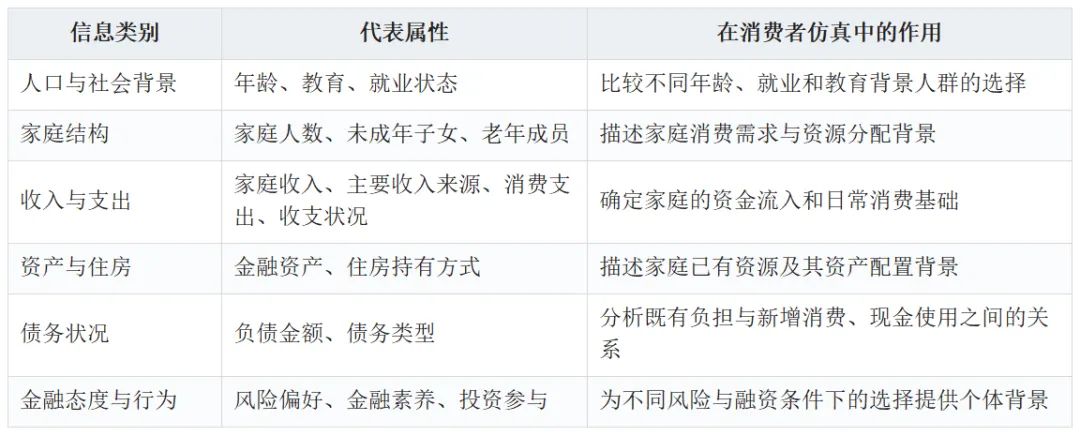
Researchers can then select different groups of households, or have the same groups of households face the same consumption task, and compare how age, income, number of households, or financial circumstances change decisions.
In large-scale processing, these fields are stored in numerical coding, which makes it easy to filter, group and batch; before entering the decision-making model, it is converted into a family description that the model can read. The unified structure allows the same image to enter different financial tasks and allows different models to compare under the same family conditions.
Building data: Preserving links between family attributes
This family portrait is based on real survey data. The team first completes the data cleanup, translation and statistical calibration of the data, organizing the family background and financial information into a common structured representation, and then builds a large-scale synthesis of the population.
The relationship between household attributes is important in the construction process. Income, consumption, assets and debts often change together, and age and household structure also affect these financial characteristics. S2-MAS collectively samples the relevant financial attributes under conditions such as age, household income and total expenditure, and maintains the combination of attributes through compatibility constraints.
For example, two households with similar incomes may have different assets and debts, or may incur different consumption expenditures. The generation process maintains these differences while maintaining the link between income, consumption, and financial conditions, allowing subsequent models to choose between different household conditions. When expanded to 500 million images, the team further calibrated and refined selected population distributions such as household size, debt, housing holdings, and financial assets.
The team also used main component analysis (PCA) to examine how attributes such as income, expenditure, assets, and debt change together. In 50 data slices of 500 million images, the first main component explains an average of 32.62% of the differences, with the contribution of main attributes staying stable between slices. This analysis was used to examine the financial structure of post-population expansion to provide the basis for subsequent grouping experiments.
Coherence test: whether the image is accurate, complete, and consistent
In image quality verification, S2-MAS follows MatrAIx's five-dimensional image quality evaluation framework and uses the same 100-bit image, 6-bit human scoring array to evaluate the design, with five aspects ranging from accuracy, unsubstantiated inference, information coverage, internal consistency, and overall resolution.
Researchers selected 100 real-life, post-processing survey images and evaluated 44 post-processing reference fields. Each scorer scored 1-5 points on five dimensions of the entire image, resulting in an artificial score of 3,000.
The results showed that the total human-made quality of images averaged 4.570/5, with a rating of 4 or 5 points for 87.8%. Of these, accuracy was 4.685/5, internal consistency was 4.670/5, and information coverage was 4.985/5.
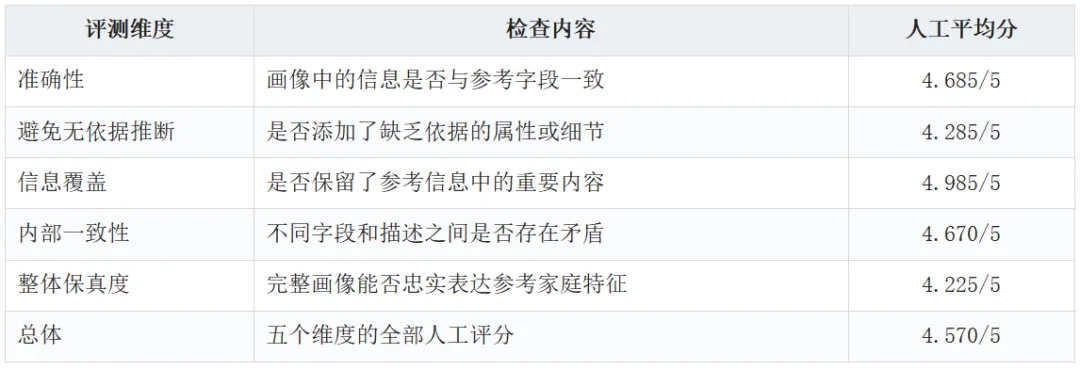
Information coverage was particularly prominent: 591 out of 600 coverage scores. This means that the images retained the vast majority of the household information needed to be presented when converted into model readability descriptions. The team simultaneously used DeepSeek and GLM to evaluate and compare their scores with the average values of six human scores. Both models completed 500 images with a dimensional cube comparison, each scoring 94.0% against an artificial score of no more than 1 point. Further use of DeepSeek V4 Pro and GLM 5.3 reviews, with an internal consistency of 94.3% and 94.0% respectively. See the full results of the S2-MAS textbook Figure 4 and Supplementary Methods M247. Artificial intelligence, model consistency with artificial intelligence, and response to known errors together constitute the test results for image quality.
Model: From Token to single card generated 370,000 tokens/s
A typical generated large model returns the answer automatically: the first token is generated by the master, and then the next one is generated based on the already available content until the end of the entire response. Even if only a structured option such as {"choice":"B"} is required, the model will still gradually generate the text and then be processed into action.
Most decisions in the simulation are essentially a structured choice: given the current family situation, a specific problem and several clear executable options, which one will the family choose?
Therefore, in the model structure, S2-MAS uses the pre-training mainstream + decision headings: by ModernBERT or Qwen dealing with family status, problems and candidate actions, then by decision heads scoring candidate actions, and decision heads consisting of trainable scoring networks and a unified layer of probability: it maps the hidden vectors of each candidate action corresponding to a parameter score, and then converts the total to a choice probability of 1 through softmax, no longer autoregression.
In other words, the decision model will directly give an option's choice, rather than a token-by-token output.
At the same time, in order to ensure the quality of the simulation, the team trained decision-making models specifically prepared for the scenario, scoring candidate actions directly and producing selection probabilities. The team compiled 4.17 million real-world survey questions and answers into a unified format of "Home Status + Problems + Options", which were strictly grouped according to the respondents training, development and test sets.
In the training decision-making model, the S2-MAS system compares six mainstream implementations to build decision-making models around two types of pre-training master codes. One class uses the Modern BERT encoder to split the candidate's architecture along the Laya, forming a compact YN-mini route; the other uses Qwen3.5-4B-Base and Qwen3.5-9B to train decision-makers on the master codes and compare the effects of different adaptations by freezing the master codes or joining the LoRA.
ModernBERT encoder SFT: Overseeing Laya's encoders and choices, studying responses from survey records, or targeting family attributes.
ModernBERT encoder SFT→CE: Starting from the SFT checkpoint, continue using cross-country training to increase the changes brought about by training inputs.
ModernBERT encoder SFT→RLCD: Following the supervision of micro-modulation, combined the cross-section with a strategy gradient based on probability rating rewards, continues to optimize the probability distribution of candidate actions.
Qwen 4B Freeze Master Key + Decision Header: Fixed Qwen 3.5-4B-Base master key parameters, trained decision heads only.
Qwen 4B LoRA+ decision maker: Co-training LoRA adapters and decision makers on Qwen 3.5-4B-Base.
Qwen 9B LoRA+ decision maker: The corresponding schematics were used in Qwen 3.5-9B, resulting in a larger mainstream effect. Eventually, the team opened up a family of YN decision models covering 421M, 322M, 4B and 9B's four parameter specifications (a total of 10 training variants that supervise the role of fine tuning, continuous training, mainstream adaptation and scale models) and a complete training and evaluation code.
In addition, the YN model families also include the YN-Master-9B and YN-Dual-belief series: the former focuses on the generalization of financial professional questionnaires, the latter explores the belief model and the two-headed architecture, both of which excel in their respective assessments.
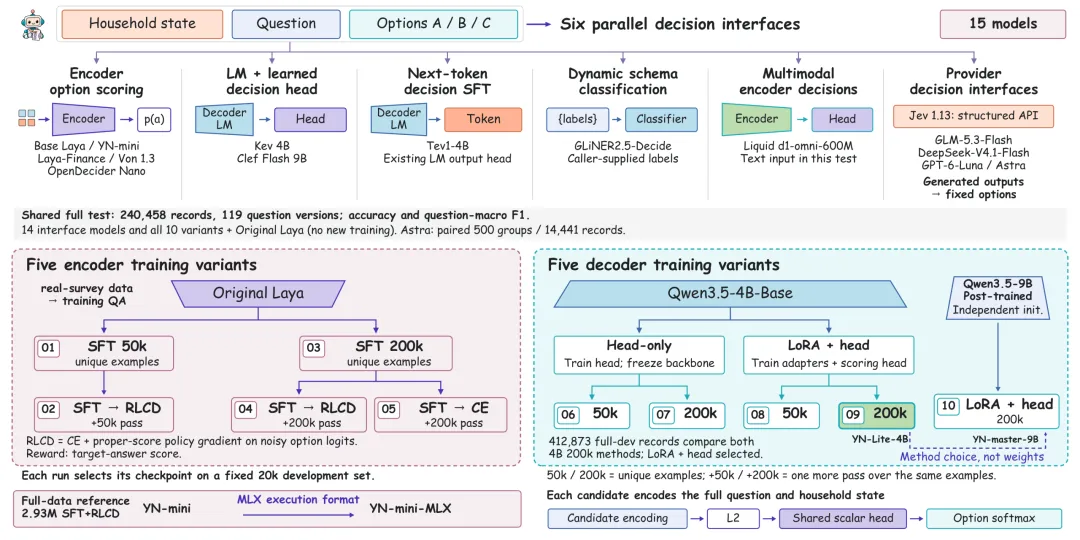
Decision model interfaces and training routes. The first half (a) of the 15 models in the joint test were divided into 6 class routes by interfaces; the second half (b) of the team on two main platforms, the Laya encoder and the Qwen3.5, compared the system to SFTs, continued CE, SFT+RLCDs, and LoRAs, forming 10 public training versions.
Simulation effects testing in 240,000 scenarios
In the remaining 240,458 single-track consumer financial selection questions (covering 119 problem versions and 8,275 interviewed household groups), the team tested the YN-mini with multiple mainstream general-purpose models and dedicated decision-making models to simulate in-situ effects:
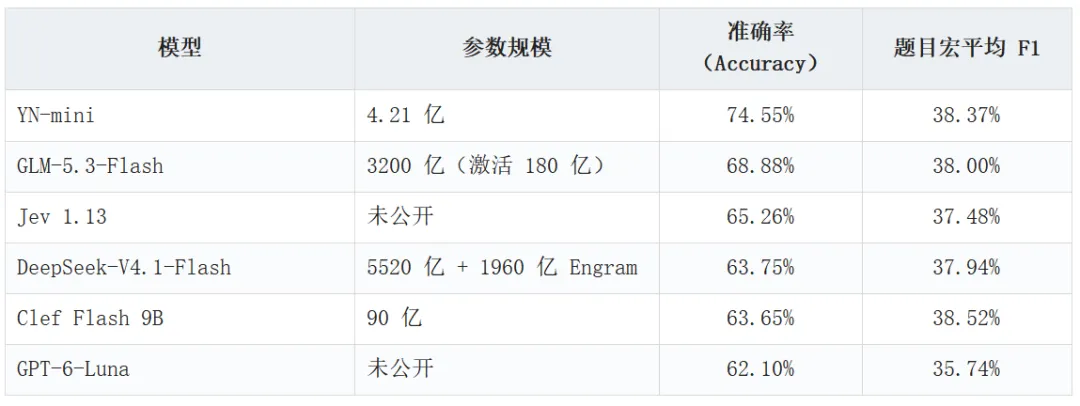
Note: Selected from the paper Table 4a, the full table contains 14 commentary models and baselines, and the test set contains the same 240,458 items that leave a record of consumer financial questionnaires).

Note: The paper Table 4b matched the GPT-6-Astra on a fixed group sampling sample in the same 500 groups (recorded 14,441):YN-mini with 74.73% accuracy / 37.30% F1, GPT-6-Astra with 69.34% accuracy / 36.24% F1.
On this Consumer Financial Choice benchmark, the YN-mini, with only 421 million parameters, achieved the highest accuracy in the review model: 74.55%: 9.30 points higher than the Jev 1.13, 5.68 points higher than the GLM-5.3-Flash, with 320 billion total parameters; and 5.39 points higher than the GPT-6-Astra in fixed-mode sampling.
This means that in-scenes one-shot simulation, expensive api and large cluster deployments are not necessary. Of course, this advantage is aimed only at priority simulation within a single scene, not at generalization and open reasoning.
In a single A100 deployment test, theYN-mini reached 370,000 tokens/s, 22.72 times the throughput of the Jev API, and tens of thousands of household decisions, which transitioned from "unmanageable" to "running fast".
Engine: Performance and structure needed to support tens of millions of simultaneous decision-making
Millions of households decide at the same time that the executive engine behind the model is to get the GPU and the model, and must ensure that the financial accounts are not messed up.
The Genese engine, which was previously developed by Prof. Rowan's team, played a significant role in combining the microservices architecture with ECS acceleration, creating a balance between flexibility, transaction consistency, and speed.
Quantity updates of physical silicon component arrays: household status is stored according to structured arrays, and similar financial updates complete one-time vectored batches, rather than per-household cyclical modifications;
State and event atoms submitted: State of the world, event logs and command results are written together within the same transaction boundary, eliminating the state drift of "recorded, unrecorded";
Quick-roll recovery: automatically rolling back to the current round of start-up when any partition step updates the anomaly;
Perhaps asynchronous flow lines: data preparation, model reasoning and bookkeeping overlapping in different batches, eliminating the GPU's vacuum waiting.
Application rules plug-in: rules for consumption, financing, payment, etc. are implemented through unified state, decision-making and execution of interface access; when new or adjusted experiments, rule modules can be replaced, and experimental scenarios can be flexibly extended.
The application-level monthly household accounts are divided into the smallest monetary units and are settled according to the fixed accounting order of income, borrowing, consumption and maturity repayments, with each cash gap remaining separate.
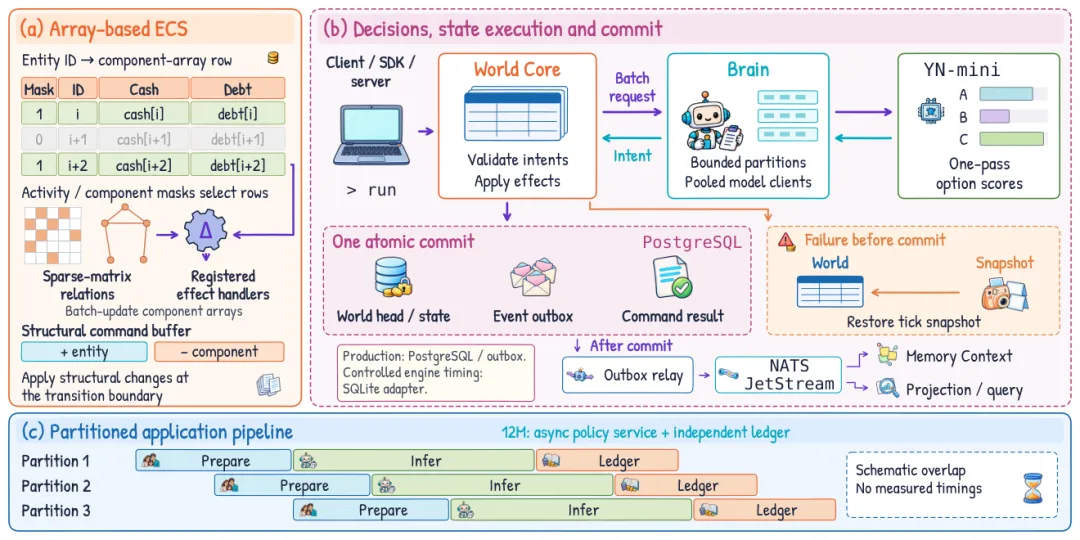
The Genese engine's state updates the boundaries. The "world" stores the state of the home with an array of physical components, decomposing requests to the "brain" to make batch decisions, validating action intentions and submitting event-recorded atoms; data preparation, model reasoning, and overlapping of logging flows in different segments.
With the same real-world model running on a single T4 GPU on a controlled performance benchmark, Genese's single-cycle running time is 6.17 seconds, saving about 17% and 20% of the time of OASIS and OneSim respectively; when fixed decision-making back-end, purely rating engine scheduling and accounting expenses, Genese's execution speed is 2.12 to 4.10 times that of AgentSociety, OneSim, OASIS and MiroFish.
In the formal operation of 12 million households, Genese divided the tasks into 2,400 work units, running parallel upstream on 14 GPUs, maximizing model performance, completing an average of about 1,672 household decisions per second on an end-to-end basis and processing about 88,60,000 tokens/s.
Scaling and coordinating effects
Combining the 500 million image libraries, the YN-mini decision-making model with the Genese engine constitutes this large-scale experiment.
The team pulled 12 million different synthetic households from the population database, and each family faced two sets of matching conditions: "20,000 yuan consumption target + 20,000 yuan allowance quota" and "30,000 yuan consumption target + 30,000 yuan allowance quota".
Simulation scale: 12 million different synthesized households, 24 million coupled decisions, 288 million monthly accounts;
Hardware configuration: 14 GPUs ((8 × H100 80GB + 6 × A100 40GB);
End-to-end use time: 3 hours 59 minutes 17 seconds (14,356.98 seconds)
In a paper statistically completed large-scale model-driven multi-smart object simulation study (Table S9), the previous work ranged from tens of thousands to millions of smart objects, and S2-MAS will actually complete the simulation of heterogeneous households to ten million.
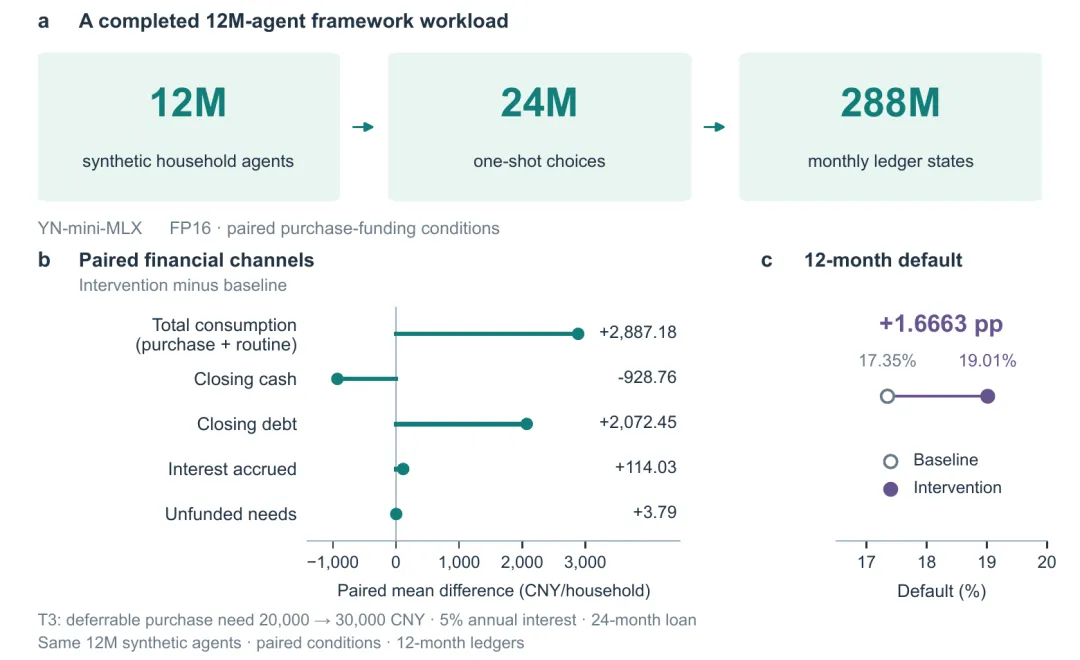
Twelve million households pair experimental designs. Each household makes a choice under two purchasing targets and licensing conditions, completing a total of 24 million selections, calculating 288 million monthly account statuses; the average changes in household consumption, maturity cash, liabilities, and simulated default rates after improving the conditions are shown on the right.
In terms of overall average value, when the purchase target was raised from RMB 20,000 to RMB 30,000 simultaneously with the authorization ceiling, the average total consumption per household for the full year increased by RMB 2887.18, the cash on maturity decreased by about RMB 929, the liabilities on maturity increased by about RMB 2072, and the simulated default rate increased by about 1.67 percentage points.
But the real value of a million-scale scale is being able to break down the overall average to see the differential response of families in different situations:
Age differentiation: decision-makers have the largest increase in household consumption at 25 to 34 years old, with an average of 9161.69 yuan; 55 to 64 years old households have only increased by about 13 yuan; and 236.4 million households over 65 years old have all opted for temporary purchases under two conditions.
Differences in education and purchase transformation: After standardized age and income distribution, the consumption growth of university-educated households was about 3821 yuan, and of primary and lower-educated households about 398 yuan.
The balance sheet situation: households with debts of 2 million to 5 million yuan at the beginning of the period, with new consumption almost entirely transformed into maturity liabilities; while households with no initial debt are more likely to digest through the use of cash reserves and periodic repayments.
An approximate overall average of tens of thousands of households can be estimated, but in order to continue to cross-sect education, employment, assets, and liabilities in 42 "age-x-income" grids and maintain statistical stability, each subgroup must contain enough households.
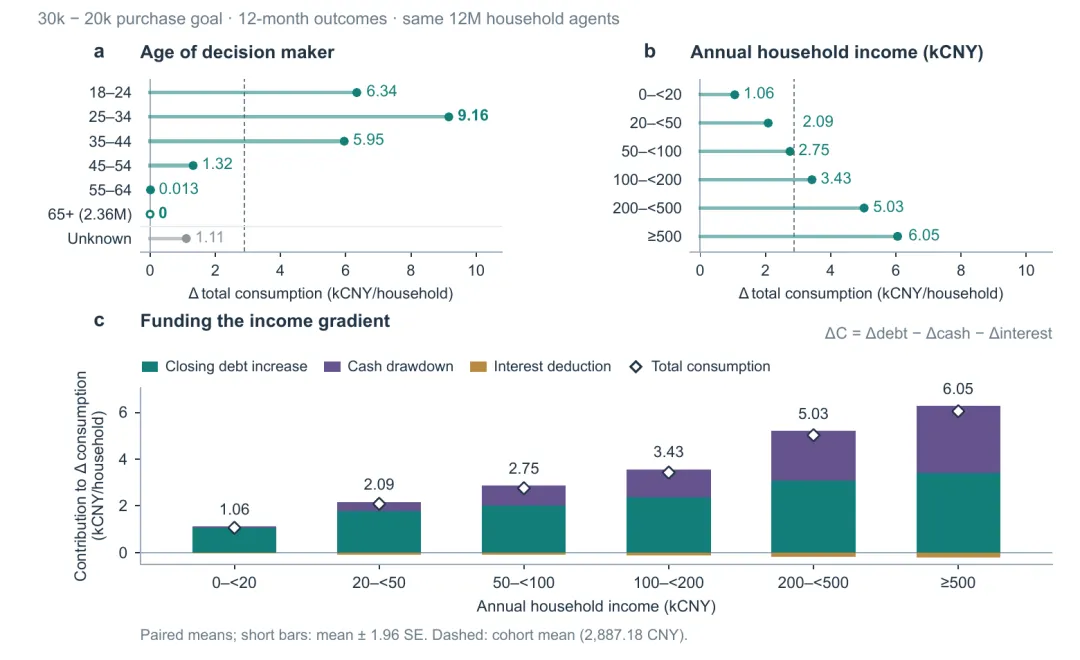
The heterogeneity of consumption in different groups of households is broken down into financial channels. Increases in consumption are markedly differentiated by the age of the decision-maker and household income; the accounts further break down the additional consumption into cash use, repayments over the term and new liabilities over the term.
From scenario simulation to household consumption forecasting
After completing a scenario simulation of tens of millions of households, the team tested the consumption record model of real households: given the households' income, cash and policy changes, could the YN model predict how much they would spend a year?
A fully rational benchmark constructed using the HANK-style home optimization approach is used to solve the optimal consumption and savings arrangements of households under budget constraints. TheYN model gives probabilities directly to 33 available consumption options, executing one of the highest probabilities per month, and then updating the remaining cash.
Experiments selected the 2018 tax reform as a policy scenario. Starting on October 1 of the same year, the basic deductions from wages were increased from $3,500 per month to $5,000 per month, and the tax rate ranges were adjusted. The simulation started from the status of the known policy arrangements in September, with the tax increases being counted into the budget in October.
Policy Based on: Ministry of Finance, Tax Office Finance Tax No. 98 (September 7, 2018)
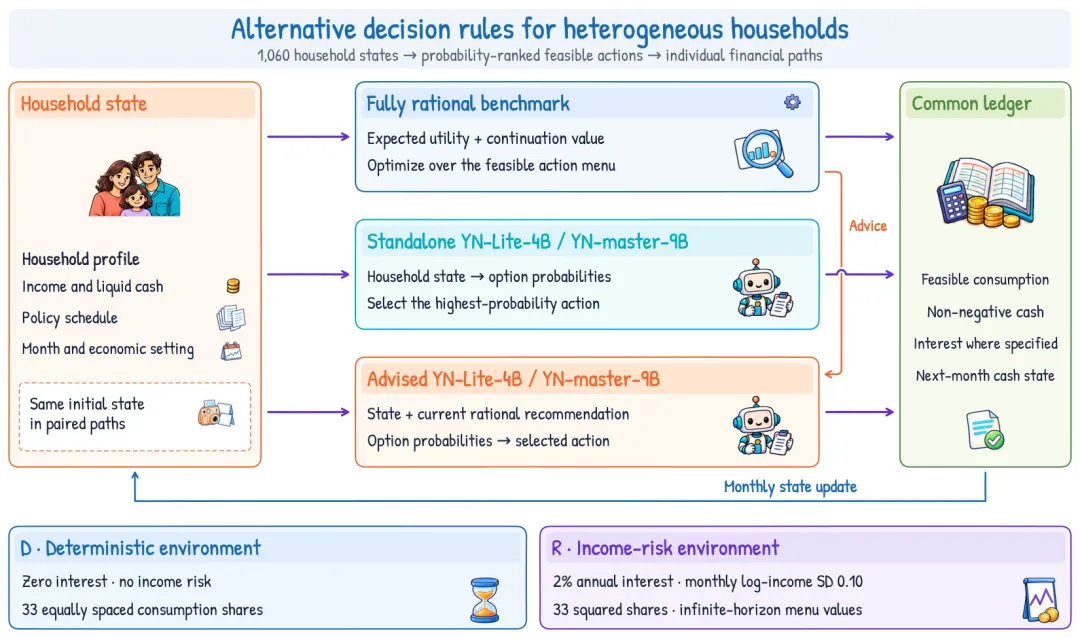
The process of forecasting household consumption (Figure 10): From household income and cash, the decision-making rules determine monthly consumption, the accounts update the balance of cash and go into the next month. The chart shows a model of independent decision-making and rational recommendation at the same time; D indicates an income-determined environment and R indicates an income-risk environment.
9B Reducing household-to-household forecast errors 4B Reducing income distribution bias
The annual average absolute error (MAE) of YN-master-9B for individual households compared with actual consumption and independent decision-making was 51,312, down 3.42% from the rational benchmark; the average root error (RMSE) decreased 3.15% for larger errors.
Researchers also divided households into low, middle, and high three groups by income, checking for predictions that a family as a whole would be overestimated or underestimated.YN-Lite-4B was closer to the real in this comparison, measuring the matching distance of the average group to the numerical error by 14.26% lower than the rational benchmark.
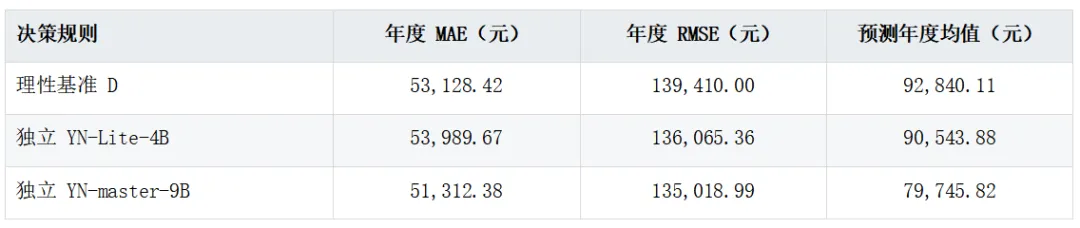
The results are calculated by household weight in terms of 2018 nominal yuan; actual annual average consumption is 99,300.73 yuan. The table compares with fixed income, zero interest rates and the same consumption options (D environment).
The improvement in the per-family error of 9B was mainly from high-income households, where the MAE group decreased from 90,874 to 83,282 from the rational benchmark. See Table 9 for the low- and middle-income groups and groups of MAE divided by wealth.
Two comparisons of household consumption forecasts (Figure 11): on the left, the forecast error is measured for each household, and on the right, the systematic deviation is measured by income and wealth groupings; the lower the number, the closer to the actual record. The chart lists both models of independent decision-making and rational advice, with D, R, respectively, representing an environment in which income is determined and income is at risk.
Does the model remember the historical answer?
Using a past policy-checking model, there is also a problem: it may have seen the relevant history during training. The team therefore retains the content of the tax cuts policy, only changing the year from 2018 to 2031, to see if the model will still make the same judgments in future years. The test only provides policy descriptions, asks for the direction of consumption throughout the year, the extent of change and the direction of consumption in December; by rewriting the questionnaire, changing the order of options, each model forms 12 groups of different controls per year only.
In each of the 12 group controls, the highest probability options are all consistent: 9B still chooses zinc to increase zinc over the entire year and December on the consumption direction questions; 4B chooses zinc to uncertain zinc; 4B chooses zinc to uncertain zinc over all three categories.
The experiment used the YN decision model for household consumption forecasts that could be compared with real-life records, and provided another viable route for large-scale simulation: allowing the model to make decisions based on the situation of each household, and then using a single account to calculate the financial changes brought about by these choices.
This is a massive simulation of everyone.
The longer-term implication of S2-MAS is to reduce the social barrier to simulation research. This pathway provides more options for research teams with limited resources: starting from specific scenarios, training models for tasks, applying limited algorithms to larger populations, finer groupings, and comparing more programs.
Decreased computational costs will also change the questions that researchers can raise. How changes in the environment and rules affect different groups, how individuals choose to combine the overall results, and how the effects of the same program vary from person to person. These problems need to be repeatedly compared under different conditions.
Technical equilibrium also requires continuous use of research resources. The team has published YN decision-making models, six training routes corresponding to 10 versions of contrast training and supporting training and evaluation codes, and has provided research drawings and scripts reproducing aggregated results, 2 million independently synthesized family images and 32,000 unlabeled task inputs.
Researchers familiar with macroeconomics, local economics and family behaviour can construct tasks that are close to real-world work and test simulations with real-life behavioral evidence; model researchers can improve decision learning, probability calibration and cross-scenario adaptation; developers can improve batch reasoning, experimental organization and outcome analysis tools. Unified task-to-decision interfaces make it easier to connect these tasks and compare different approaches under the same conditions. Communities can accumulate together and will be a continuously expanding set of experimental methods and research experiences.
Technology parity ultimately leads to research and commercialization opportunities: enabling more teams to come up with their own problems, run their own experiments. In this sense, the perfect combination of the YN decision model and the Genese engine demonstrates the viability of social-scale simulation in broader fields such as policy making, marketing forecasting, and transaction forecasting.
About Professor Rohan and the S2-MAS team
Professor Rohan graduated from MIT with a bachelor's degree in mathematics and economics and a Ph.D. in economics. He is currently a lifetime associate professor at the Hong Kong University School of Management, and has served as co-director of the Center for Social Science and Intelligence at Shenzhen University since 2025. S2-MAS was completed jointly by a research team led by Prof. Rohan of Hong Kong University, the Joint Shenzhen University of Technology, California Institute of Technology, National University of Singapore, South China University of Technology, Ann Arbor, University of Michigan, Hong Kong Chinese University, and Jiangxi University of Technology.
The first author of the paper was Li Yang Li of the University of Hong Kong, co-authored with Wang Yike Wang, and communications author is Professor Ye Luo of the University of Hong Kong. The authors include: Di Wan of the University of Hong Kong, Chujun He of the University of Hong Kong, Zongsi Xu of the University of Hong Kong, Yitao Yu of the University of Hong Kong, Shuai Zhong of the University of Hong Kong, Minghao Pan of the California Institute of Technology, Quanfeng Lu of the University of Hong Kong, Xiyu Chen of the University of Hong Kong, Sheng Zhong of the University of Hong Kong, Deng Binjie of the University of Hong Kong, Yichen Guo of the University of Hong Kong, Zhenwei Guo of the New National University of Hong Kong, Huan Jun University of Hong Kong, Zheng Guo of the University of Hong Kong, Wei Lin University of Hong Kong, Zuo Zhou of the University of Hong Kong, Zheng Jian University of China, Zheng Jian University of Hong Kong, Zheng Jian University of Hong Kong, South China. In the meantime, we're going to have to make a decision.